📊 Reports & Analytics — User Guide

Make Smarter Decisions with Data

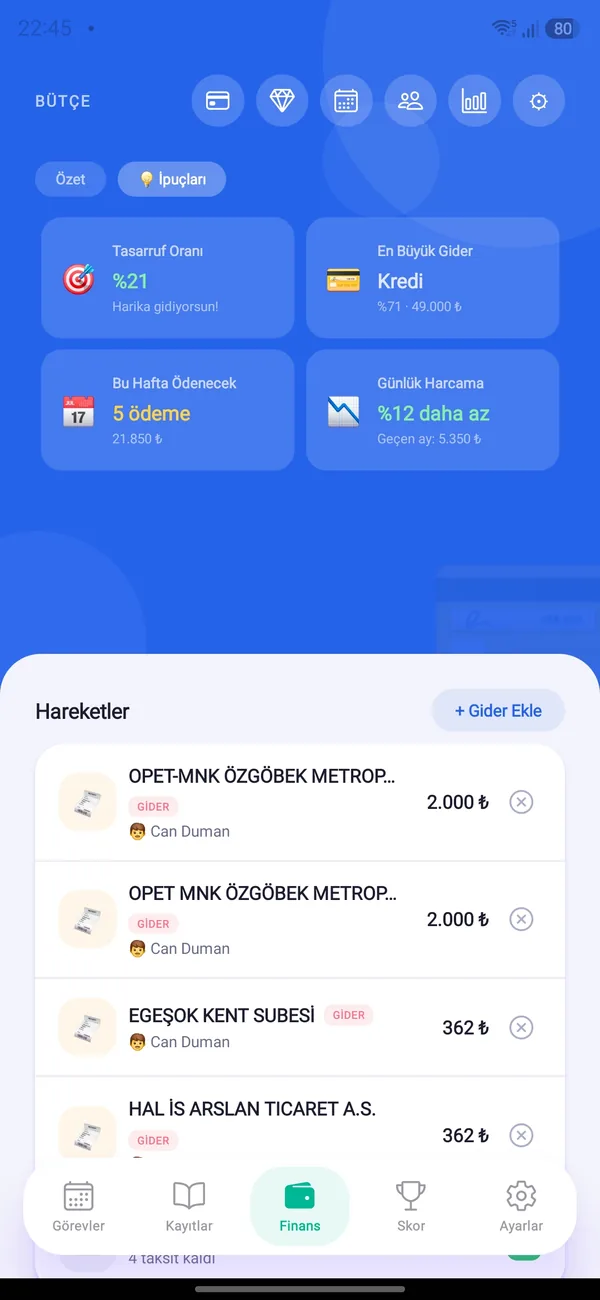
Discover spending habits with weekly summaries and financial charts. Clearly see where and how much you spend — make informed decisions.

✓ Weekly Summary ✓ Financial Charts ✓ Period Comparison ✓ PDF Export
Google Play
Raporlar
How to Use It?

The Reports Module, Feature by Feature

📅 WEEKLY REPORT

The Week's Summary on One Screen

See the last 7 days of spending and task summary. Compare with the previous week to understand your trend.

  • Weekly total spending and top spending category
  • Completed and overdue task counts
  • Comparative view with previous week
  • Automatic summary notification every Sunday evening
📅

Weekly Report

Spending + Task Summary

📈 FINANCIAL REPORT (PREMIUM)

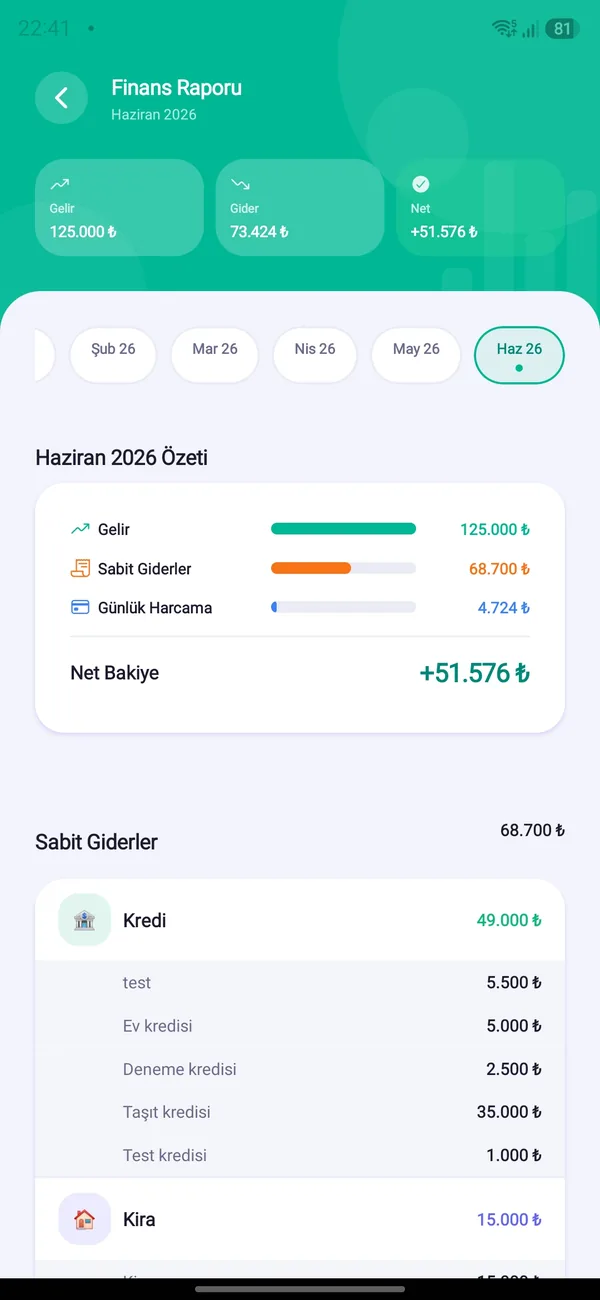
Monthly Charts and Category Analysis

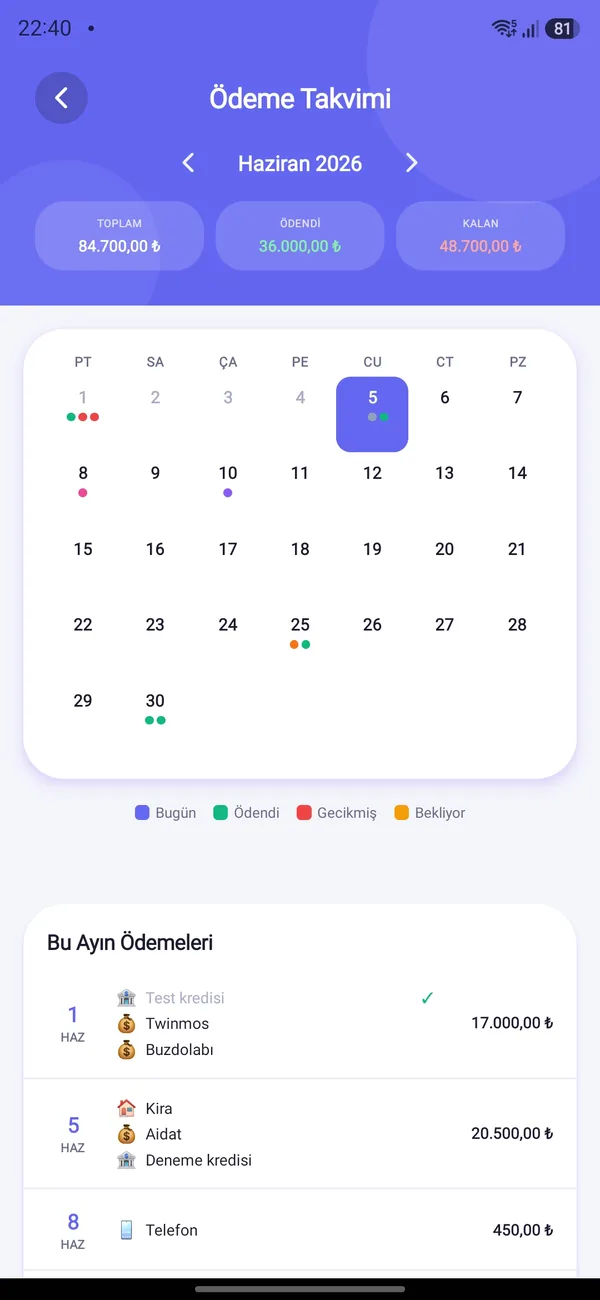
See monthly income-expense balance, spending distribution by category and instalment load in charts. Swipe to compare past months.

  • Category spending breakdown as pie chart
  • Income vs expense bar chart
  • Period comparison by swiping to past months
  • Export report as PDF
📊

Financial Report

Charts & PDF Export

🔍 PERIOD SELECTION

Review Past Periods

Select different months and weeks to review past period reports. Data updates automatically — no manual action needed.

  • Monthly and weekly historical period selection
  • Data updates automatically
  • Comparative period analysis
  • Track spending trend month by month
🗓️

Period Selection

Monthly & Weekly Analysis

More Features

The Complete Reports Module

🥧
Pie Chart

Visually understand how much you spend on each category.

📊
Bar Chart

See monthly income vs expense comparison as a bar chart.

📤
PDF Export Premium

Save or share your financial report as PDF.

🔄
Auto Update

Reports update instantly with every new expense.

📋
Task Performance

See task completion rate in the weekly report.

🎯
Goal Tracking

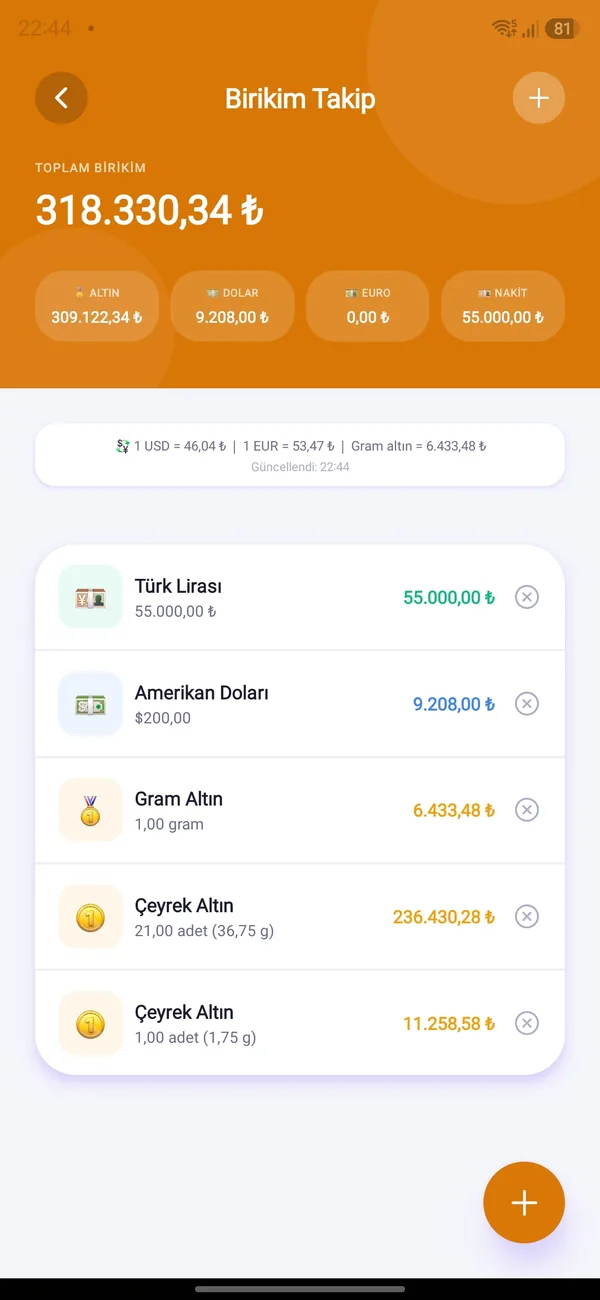
Track how close you are to your savings goals.

💡 Tips

To Get the Most Out of Reports

📅
Categorise every expense

Expenses saved without a category show as "Other" in reports — select a category to keep charts meaningful.

📊
Review monthly period report

Open the financial report at month end and check your top spending category — plan next month's budget accordingly.

📤
Save the PDF

Email the monthly PDF report to yourself or upload to cloud — archive it for annual analysis.

Related Features

Download HomBoo Now

Start analysing your spending right now.

Google Play